How long is a newborn?Birth length and birth weight in official statistics
Lovely Baby Print · Data retrieved 13 October 2026 · 22 countries and territories have an average weight and 9 have an average length
A newborn baby is about 50 cm long on average. Most averages we found fall between 48.6 and 51.2 cm (Denmark reports 52 cm, rounded to whole centimetres). The WHO growth standard has a median at birth of 49.9 cm for boys and 49.1 cm for girls. Average birth weight is mostly between 3.0 and 3.6 kg, depending on the country.
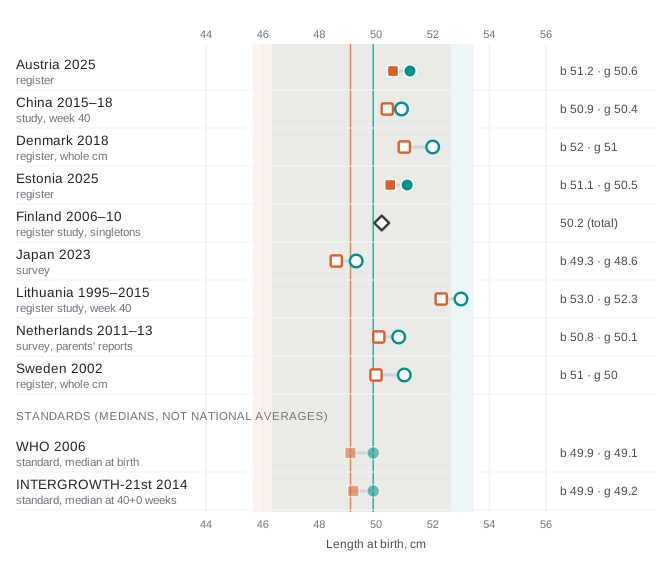
How long is a newbornAverage length at birth in the nine countries that report it, against WHO's normal range. Rows are alphabetical, not ranked.
Boys
Girls
Total (where the source does not split by sex)
Filled: register
Hollow: survey, sample, study or length rounded to whole cm
Pale: standard (median)
Coloured bands: WHO normal range, 3rd–97th percentile
Thin lines: WHO median at birth
Means unless stated; WHO and INTERGROWTH-21st give medians and are standards for how healthy children can grow, not national averages. Samples differ, so do not compare decimals between countries. Japan's and the Netherlands' values refer to survey years, not birth years. Lithuania: a register study of babies born at week 40; the authors found the median length 3–4 cm above INTERGROWTH-21st. The sample is the nine countries where we found an average length, mostly Europe, Japan and China; it is not the whole world. Sources and exact table rows: see Sources below and data.csv.
live births to mothers resident in Austria, register
Estonia
2025
50.8 cm
3,517 g
all live births, register
Netherlands
2011–13
50.5 cm
3,431 g
survey of children aged 0–4, parents' reports
Finland
2006–10
50.2 cm
3,546 g
live singleton births without antenatal steroid treatment (98% of births), register study
Sweden
2002
50 cm*
3,575 g
register, older report
Denmark
2018
52 cm*
3,486 g
register
Japan
2023
49.3 (b) / 48.6 (g) cm
3,060 / 2,950 g
national survey
China
2015–18
50.9 (b) / 50.4 (g) cm
3,500 / 3,378 g
study, born at week 40
*Rounded to whole centimetres by the source. b = boys, g = girls. The order of the table is not a ranking.
Average weight in more countries, latest year we found, in alphabetical order (not a ranking, definitions differ): Canada 3,287 g (2024; the preliminary 2025 figure is 3,292 g), Czechia 3,318 g (2024), Denmark 3,489 g (2024), Finland 3,496 g (2024), Flanders 3,306 g (2024, all births including stillbirths; live singletons 3,346 g), France 3,264 g (2021, one-week sample survey), Iceland 3,588 g (2024), Ireland 3,440 g (2021), Norway 3,503 g (2025), South Korea 3.1 kg (2025, rounded to 0.1 kg), Sweden 3,483 g (2024) and Switzerland 3,301 g (2019).
Five things the numbers show
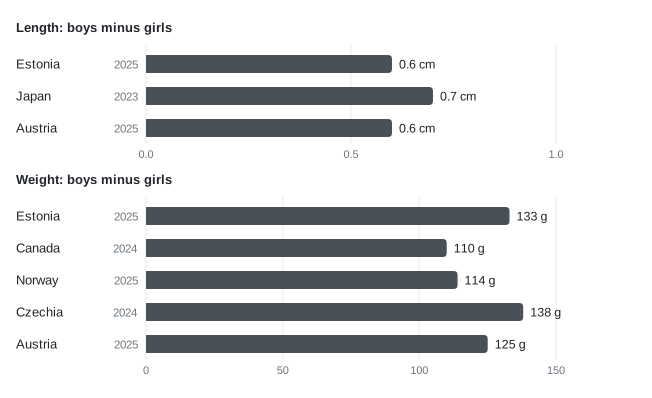
Boys are longer and heavier. In every figure we found that is split by sex, boys are heavier, and they are longer in all but three years of Denmark's series (1999–2001), where length is rounded to whole centimetres and boys and girls come out equal. In the latest national figures boys are 0.6–0.7 cm longer (Austria, Estonia, Japan) and 110–140 g heavier (Norway, Canada, Austria, Estonia, Czechia); older years and some studies show smaller or larger gaps (roughly 0.2–0.7 cm and 70–150 g). The differences are our own calculations from the sources' figures.
Boys are longer and heavierDifference between boys' and girls' averages in the latest national figures, calculated by us from the sources' figures.
Older years and some studies show smaller or larger gaps (roughly 0.2–0.7 cm and 70–150 g). Denmark and Sweden are missing here because their length is rounded to whole centimetres. The bars start at zero.
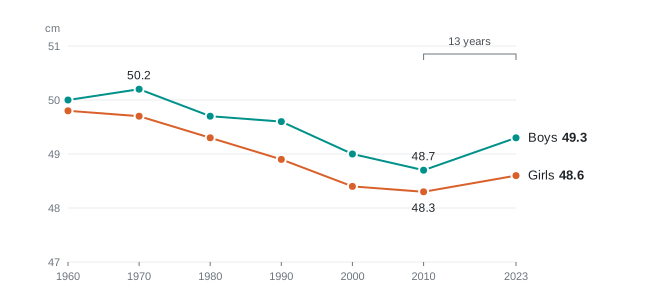
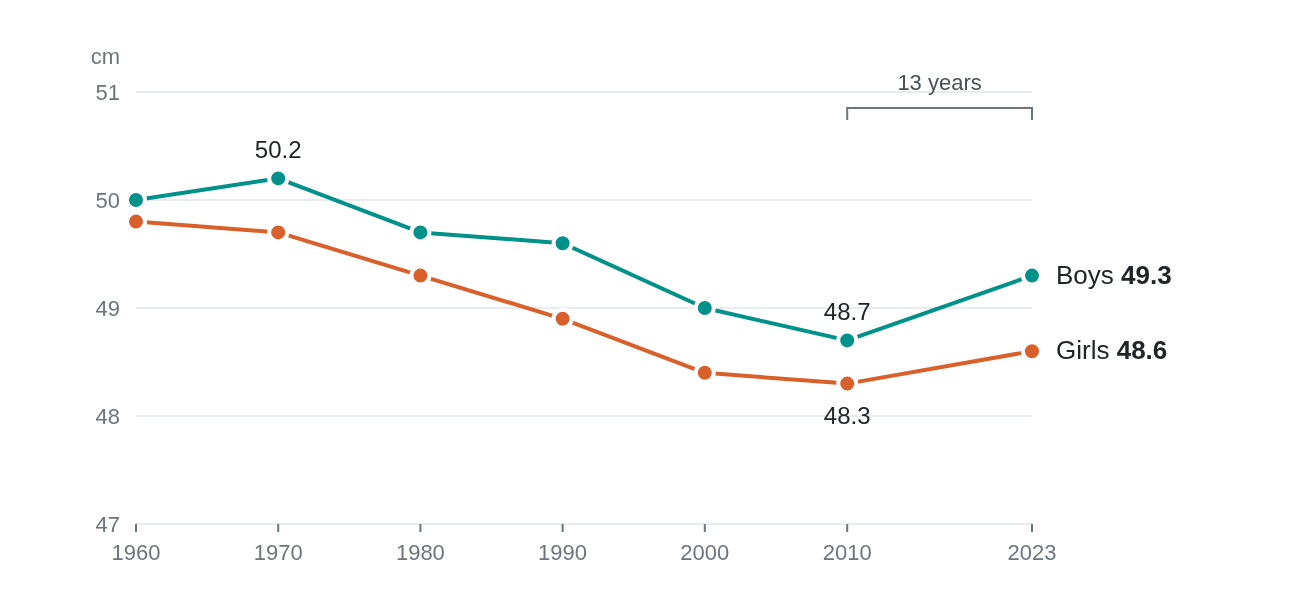
Length changes slowly. In Estonia average length was 50.6 cm in 1992 and 50.8 cm in 2025, while average weight rose from 3,449 to 3,517 g. In Japan, boys' average length fell by 1.5 cm between the 1970 and 2010 surveys (50.2 to 48.7 cm), and the 2023 survey shows 49.3 cm, 0.6 cm above 2010.
Japan: average length at birth by survey year2023 is a single new data point after 13 years.
Boys
Girls
The years are survey years, not birth years. We have not checked how older years were processed (the 2010 report smoothed its percentile values). The axis starts at 47 cm, not at zero. Source: Children and Families Agency (Japan), Infant Physical Growth Survey 2023 (published 2024).
Weight has fallen in some places. Canada went from 3,413 g (2000) to 3,287 g (2024). In the Nordic countries one harmonised source gives Iceland the highest average in 2024 (3,588 g), about 90–105 g above the other four, which are within 13 g of each other (3,483–3,496 g).
Most babies are close to the middle. Of the 9,077 live births in Estonia in 2025 with a recorded length, 52.6% measured 50–52 cm, and 51 cm was the most common. WHO's normal range (3rd to 97th percentile) is 46.3–53.4 cm for boys and 45.6–52.7 cm for girls. The shares are our calculation from the source's counts per centimetre.
Length is measured, but rarely shown. Sweden's birth register has held birth length since 1973, but we only found the average in three older reports from the National Board of Health and Welfare (for births in 1998, 2001 and 2002, in whole centimetres); its current database and the later reports we opened do not show it. We found none for Norway or Iceland, and Denmark's series ends in 2018. The reports we could open from the USA, the UK and Germany show weight in classes, not as an average.
What does 50 cm mean?
An A4 sheet is 29.7 cm long, so 50 cm is about 1.7 sheets end to end. A print in true 1:1 scale shows your baby's real length: a 50 cm baby is as long as the short side of a 50×70 cm poster. At Lovely Baby Print we print your baby's birth length in true scale.
We looked for data in about fifty countries and included only figures that an official or scientific source actually shows. 22 countries and territories have an average weight and 9 have an average length, often with caveats. Everything is a mean unless stated; WHO and INTERGROWTH-21st give medians. The figures cannot be ranked decimal by decimal: samples differ (all live births, singletons, week 40, survey versus register), measurement practice varies, and Sweden and Denmark round length. A Lithuanian register study of babies born at week 40 found 52.3–53.0 cm, which the authors put 3–4 cm above INTERGROWTH-21st. Sweden's 2024 figure is missing about 3.5% of births. Japan's and the Netherlands' values refer to survey years, not birth years.
WHO and INTERGROWTH-21st are standards for how healthy children can grow, not national averages. WHO's standards are based on 8,440 healthy, breastfed infants and young children in Brazil, Ghana, India, Norway, Oman and the USA (1997–2003). Average length by birth month, or the longest and shortest newborns, was not shown in the sources we could open. We used no modelled estimates, guesses or our own order data.
Sources
Sources (all opened 2026-10-13; year = year of publication or of the data):
Estonia: Estonian Institute for Health Development, Medical Birth Registry, 1992–2025 (database updated 2026): length, table SR32 and weight, table SR30.